.png?width=200&height=52&name=Adikteev-H-White%20(1).png)
The first in our series of three articles about incrementality, here’s a breakdown of the various measurement methodologies.
The incrementality experts
Back in 2017, our Chief Revenue Officer of Americas, Alexei Chemenda, gave a talk on measuring incrementality for re-engagement. This sparked an industry-wide shift to incrementality measurement as the standard for evaluating app re-engagement campaigns. Since then, methodologies have evolved and incrementality has been adopted as standard for evaluating campaign success, but Adikteev was the first to discuss it as a major metric.
With all the buzz around the subject, we’d like to get back to basics. Here’s a recap of the different methodologies and their pros and cons. In our next article, we’ll take a look at a topic that’s often ignored: the statistical significance of incrementality tests. Sign up for our newsletter so you don’t miss it!
What is an incrementality test and why is it important?
As we explained in a previous blog post, an incrementality test, also called an uplift test, provides insights into the real value added by a marketing strategy or vendor. In essence, an incrementality test is an A/B test, comparing the impact of showing ads to a test group against a control group that does not see any ads.
Let’s define some terms.
The test group is the group of users exposed to re-engagement ads. This group is used for the test of incrementality.
The control group is made up of users that will not be exposed to re-engagement ads. This group is used as the base to compare against the test group, and control the results.
Exposed users are users who actually saw an ad.
Unexposed users are users who did not see an ad.
Uplift is the increase (generally a percentage) of a given KPI between two groups of users, and is often used as a synonym for incrementality.
Incrementality tests allow advertisers to compare how users that are not exposed to re-engagement ads perform compared to users that are exposed to ads. By measuring the lift in the value of purchases or increased engagement that ads provide, advertisers can use the insights gleaned to better optimize and forecast ad spend, and determine the most effective strategy to achieve their goals.
As we said, there are a variety of methodologies on the market today, so let’s get into how they work, and the pros and cons of each one.
ITT (Intent To Treat): Incrementality medicine
An incrementality test a day keeps the doctor away
How it works:
Based on medical testing methodology, intent to treat (ITT) divides users into two groups:
A. the test group, which is eligible to see re-engagement ads, and
B. the control group, which will not see any ads at all.
.png)
The good news:
This methodology is easy to understand, relatively easy to implement, and easy to verify after the fact by an advertiser. In addition, since the control group sees no ads, it’s less costly than some other incrementality methods we’ll introduce you to later.
The bad news:
ITT’s main problem is noise. Unexposed users from the test group create distraction that minimizes the impact of re-engagement when comparing the test group to the whole group. 40-50% of the test group must see ads in order for the results to be relevant. Showing ads to such a large percentage of users usually requires a large budget.
PSA method (Public Service Ads): Incrementality at a cost
PSA: it’s expensive to be random
How it works:
The public service ads (PSA) method compares two exposed groups:
A. the test group, that saw re-engagement ads, to
B. the control group that saw unrelated ads, unlike in ITT. These are usually public service announcements (hence the name) from organizations like the Red Cross.
.png)
The good news:
As you serve real ads to both groups, you know exactly which users have been exposed and which have not. This is the main advantage to PSAs: you can compare users who saw ads in both incrementality test groups (either a re-engagement one, or a random one). Here, we eliminate the noise created by unexposed users in the results.
The second advantage is that this is quite easy to implement. You can create the same incrementality campaign for each group, changing only the creatives displayed.
The bad news:
The main drawback of the PSA method is its cost. Those random PSAs are expensive and they don’t bring any revenue for the brand. If you want to keep your incrementality costs down, this is a deal breaker.
The second drawback is that a PSA incrementality test ignores the defensive effect of advertising. With ITT, it’s taken into account. Users in the test group see your ads and are prevented from seeing your competitors’ ads. On the other hand, users in the control group are free to see your competitors’ ads. This allows for a more accurate view of creative performance because you can assume that you’re comparing your own ad performance with those of your competitors. With PSA, we can’t measure the defensive impact. The control group sees a random ad, potentially in place of an ad from your competitor. And you’re most likely not in competition with the Red Cross for users.
Finally, bidding optimization algorithms render PSA incrementality tests useless. These algorithms expose users in the test group that are more likely to convert. For example, the algorithm might find that one user in the test group is more likely to complete a conversion than other users, and this user will be shown more ads than the rest of the group. The optimization effect can’t be replicated in the control group, who sees random (PSA) ads.
Ghost ads: An incrementality magic trick
Watch out for what you can’t see
How it works:
The ghost ads method generates a false bid that never actually produces an ad. The advertiser then compare the test group with the users who would have seen an ad, had the bid generated a real ad. Hence the name, ghost.
To do this, an auction is simulated in real time bidding (RTB) for all users in the control group. The advertiser can then compare the fake or “ghost” bid to the real winning bid (the one that led to an impression). If the ghost bid price is higher than the winning impression price, the user would have seen a real ad. If the ghost bid price is lower than the winning impression price, the user would not have seen an ad.
.png)
The good news:
On paper, this methodology is the best. It combines the advantages of both the ITT and PSA methods. There is no noise from unexposed users, as you’re comparing exposed users to would-have-been-exposed users. And this without the cost of PSA, as you don’t pay to serve ads to the test group. Perfect!
The bad news:
The main issue here is the advertiser’s ability to verify the results. It’s actually almost impossible for an advertiser to check the results of this methodology. Determining whether or not these ghost bids would have been above the supply side platform (SSP) floor and above the winning bid is not an exact science. Advertisers must rely entirely on their partner’s word for results.
In addition, it’s not common for SSPs to disclose the floor and winning price of an auction, making it impossible to identify users who would have been exposed to ads. Unless you are Google or Facebook and have access to the whole auction process, it’s impossible to implement this method. And do you want to trust Facebook or Google to measure the impact of their own method?
Here’s a quick recap of incrementality test types:
.png)
Our solution: ITT, made better
Cut costs and noise
It’s clear that each methodology has its drawbacks, but we’ve found a way to minimize these through our own modified version of ITT.
The main objective of Adikteev’s methodology is to start from the lowest cost to run an incrementality test constraint and try to reduce the noise as much as possible to bring meaningful results. We’ve broken it down into two steps.
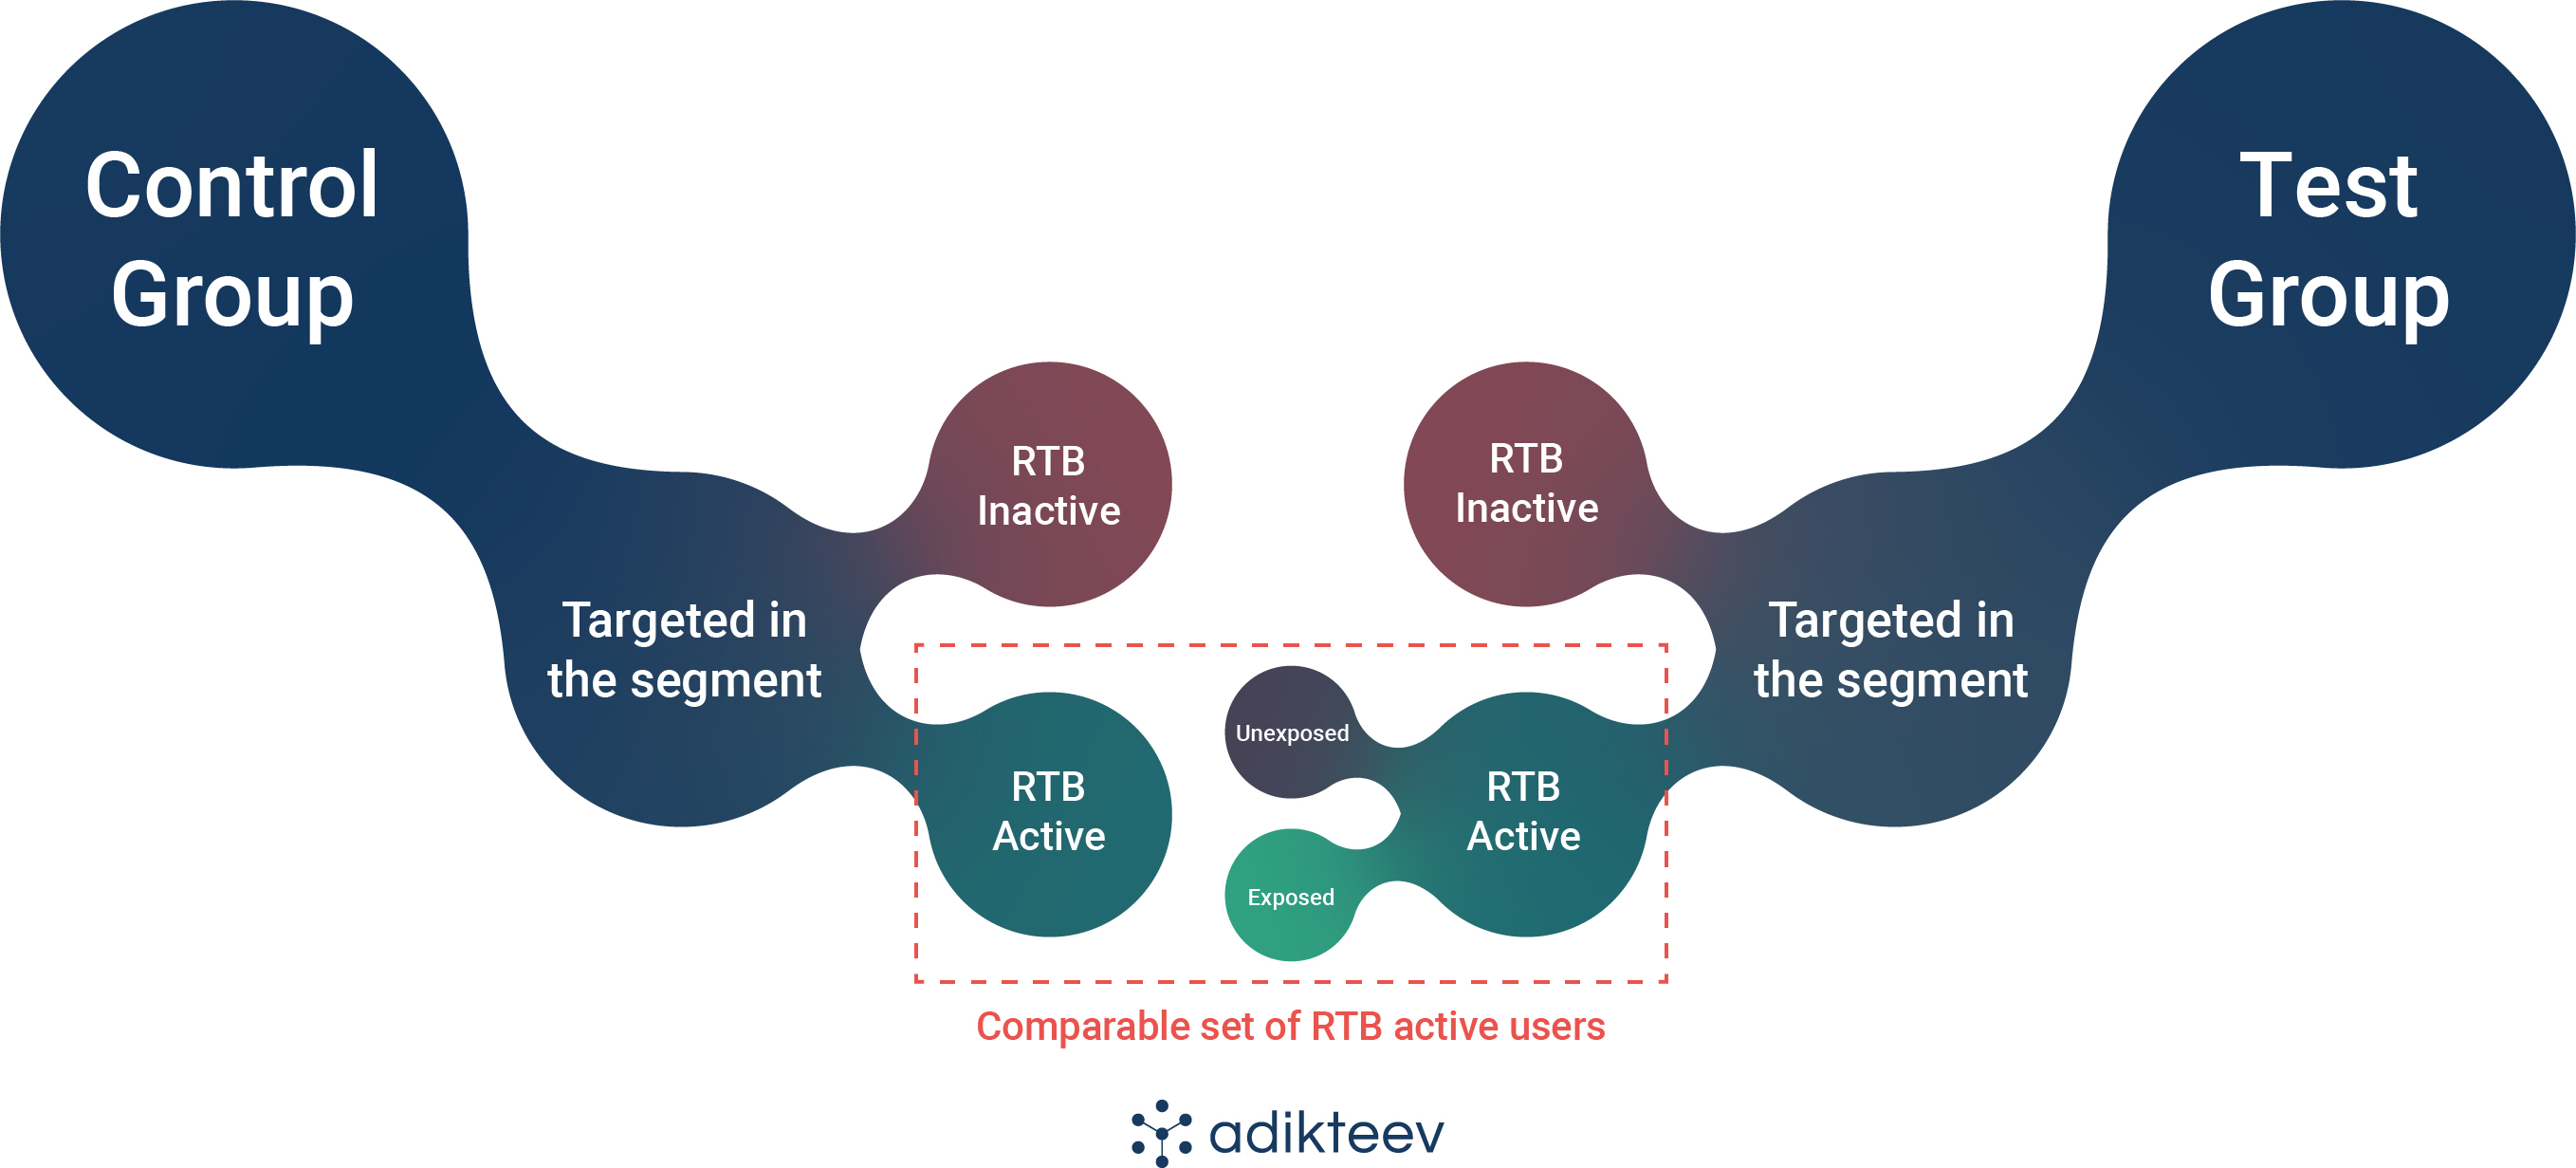
Step 1: measure incrementality at the segment level
The first step to reduce noise, is to compare two homogeneous populations (users with similar characteristics). To do so, you need to define a specific user segment (for instance “active buyers”) and divide this segment into a test and a control group.
You should avoid performing an incrementality test at the app level as users can have too many different profiles and characteristics.
Step 2: remove RTB inactive users
Some users may have just changed their device, or lost it, or they just don’t use apps that contain ads. Thus, they will never be able to see an ad, and only generate noise for the test.
We should eliminate those users from both the test and control group in order to bring even more meaningful results.
To do this, we must remove all users from both groups that were not present in the bid stream during the period of the test.
How are MMPs involved in measuring incrementality?
Now that we have established the methodology, let’s understand how MMPs are involved as the party who is responsible for measurement. MMPs play a key role in being able to create the segments that we’d want to test and keep them accurate with no overlap.
We spoke with our partners over at Singular, one of the market’s next generation MMPs, who have emphasized the importance of having a reliable, scalable system in place to generate accurate data sets for incrementality testing.
Understanding that the segments you’re creating can accurately represent users who are exposed to ads, as part of a well-defined test group, vs. a segment of users within the same campaign that will not be exposed to ads, possibly in any other medium as well, is absolutely critical to the validity of the test”, said Alon Nafta, VP of Product at Singular. “Furthermore, over time, you should make sure that you’re accurately measuring ROAS for your re-engagement activity as you will not always be engaging in testing, or may end up making changes vs. the original experiment, for example by running with a new set of creatives.
But how do we prove the incrementality test worked?
Now that we know the pros and cons of each incrementality methodology and have defined an improved method to reduce noise, we have to ensure that we’ve generated relevant results.
We believe that the most important step is determining the significance of the test, but many ignore it in favor of big, impressive-looking numbers.
Let’s take this example of the results of a three-week incrementality test:
.png)
Amazing results? Not so fast.
Based on the above table, the results of our uplift test look fantastic: +100% uplift on revenue generated sounds great!
However, in this specific case it’s too early to draw conclusions about the impact of the re-engagement campaign. We just can’t say because results are not statistically significant without context. It’s essential to determine whether we’ve generated meaningful results or if we just got lucky.
How can you know if your test was successful or not? You must ensure it has no biases. Stay tuned for our next article about statistical significance and how to interpret your incrementality test results.

Thanks to the team at Singular for their contribution!