.png?width=200&height=52&name=Adikteev-H-White%20(1).png)
![]()
GROW YOUR RETARGETING LISTS & SCALE CAMPAIGNS
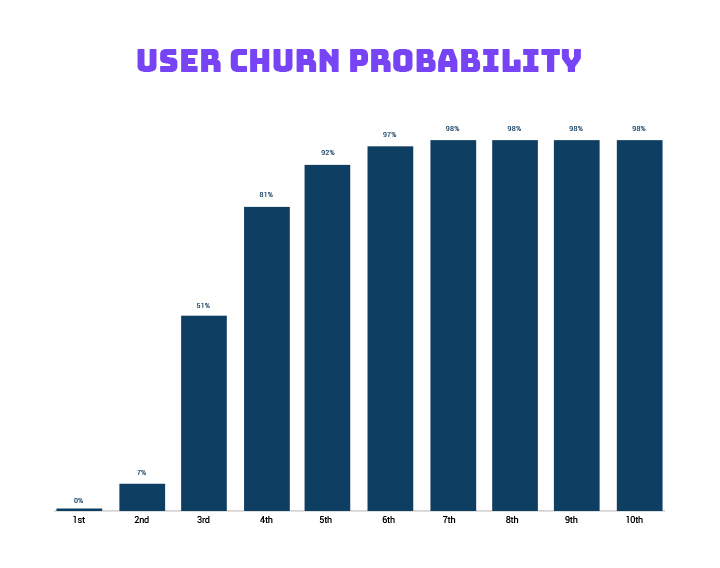
Create lists of about-to-churn users with high revenue impact
![]()
ENHANCE CRM & PUSH STRATEGIES
Integrate high-value user segments into other re-engagement campaigns
![]()
IMPROVED BUDGET DISTRIBUTION
Focus on users who are likely to churn and never waste resources on organic activity.
![]()
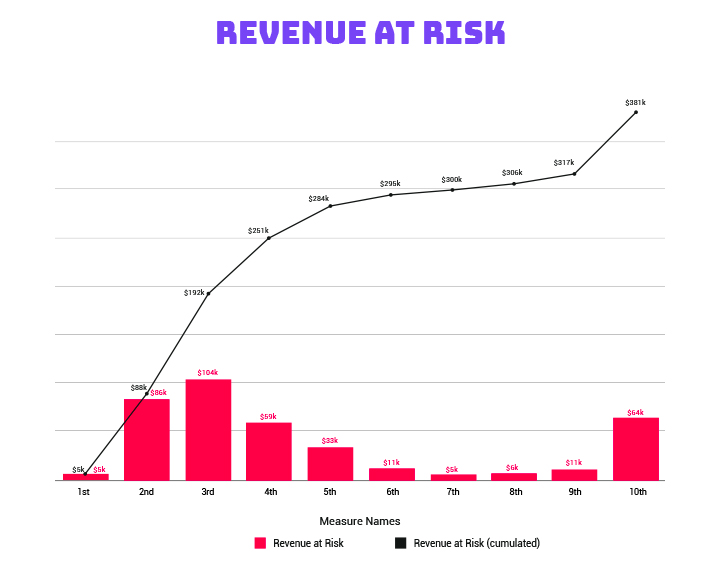
MEASURABLE REVENUE IMPACT
Assess how much revenue you might lose when users leave.